Understanding urban climate through satellite monitoring

Urban heat islands (UHIs) are areas within cities that experience significantly higher temperatures than their surrounding rural regions. This phenomenon is primarily caused by the replacement of natural surfaces with heat-absorbing materials like asphalt or concrete, high building density with limited green spaces, reduced air circulation and increased energy consumption.
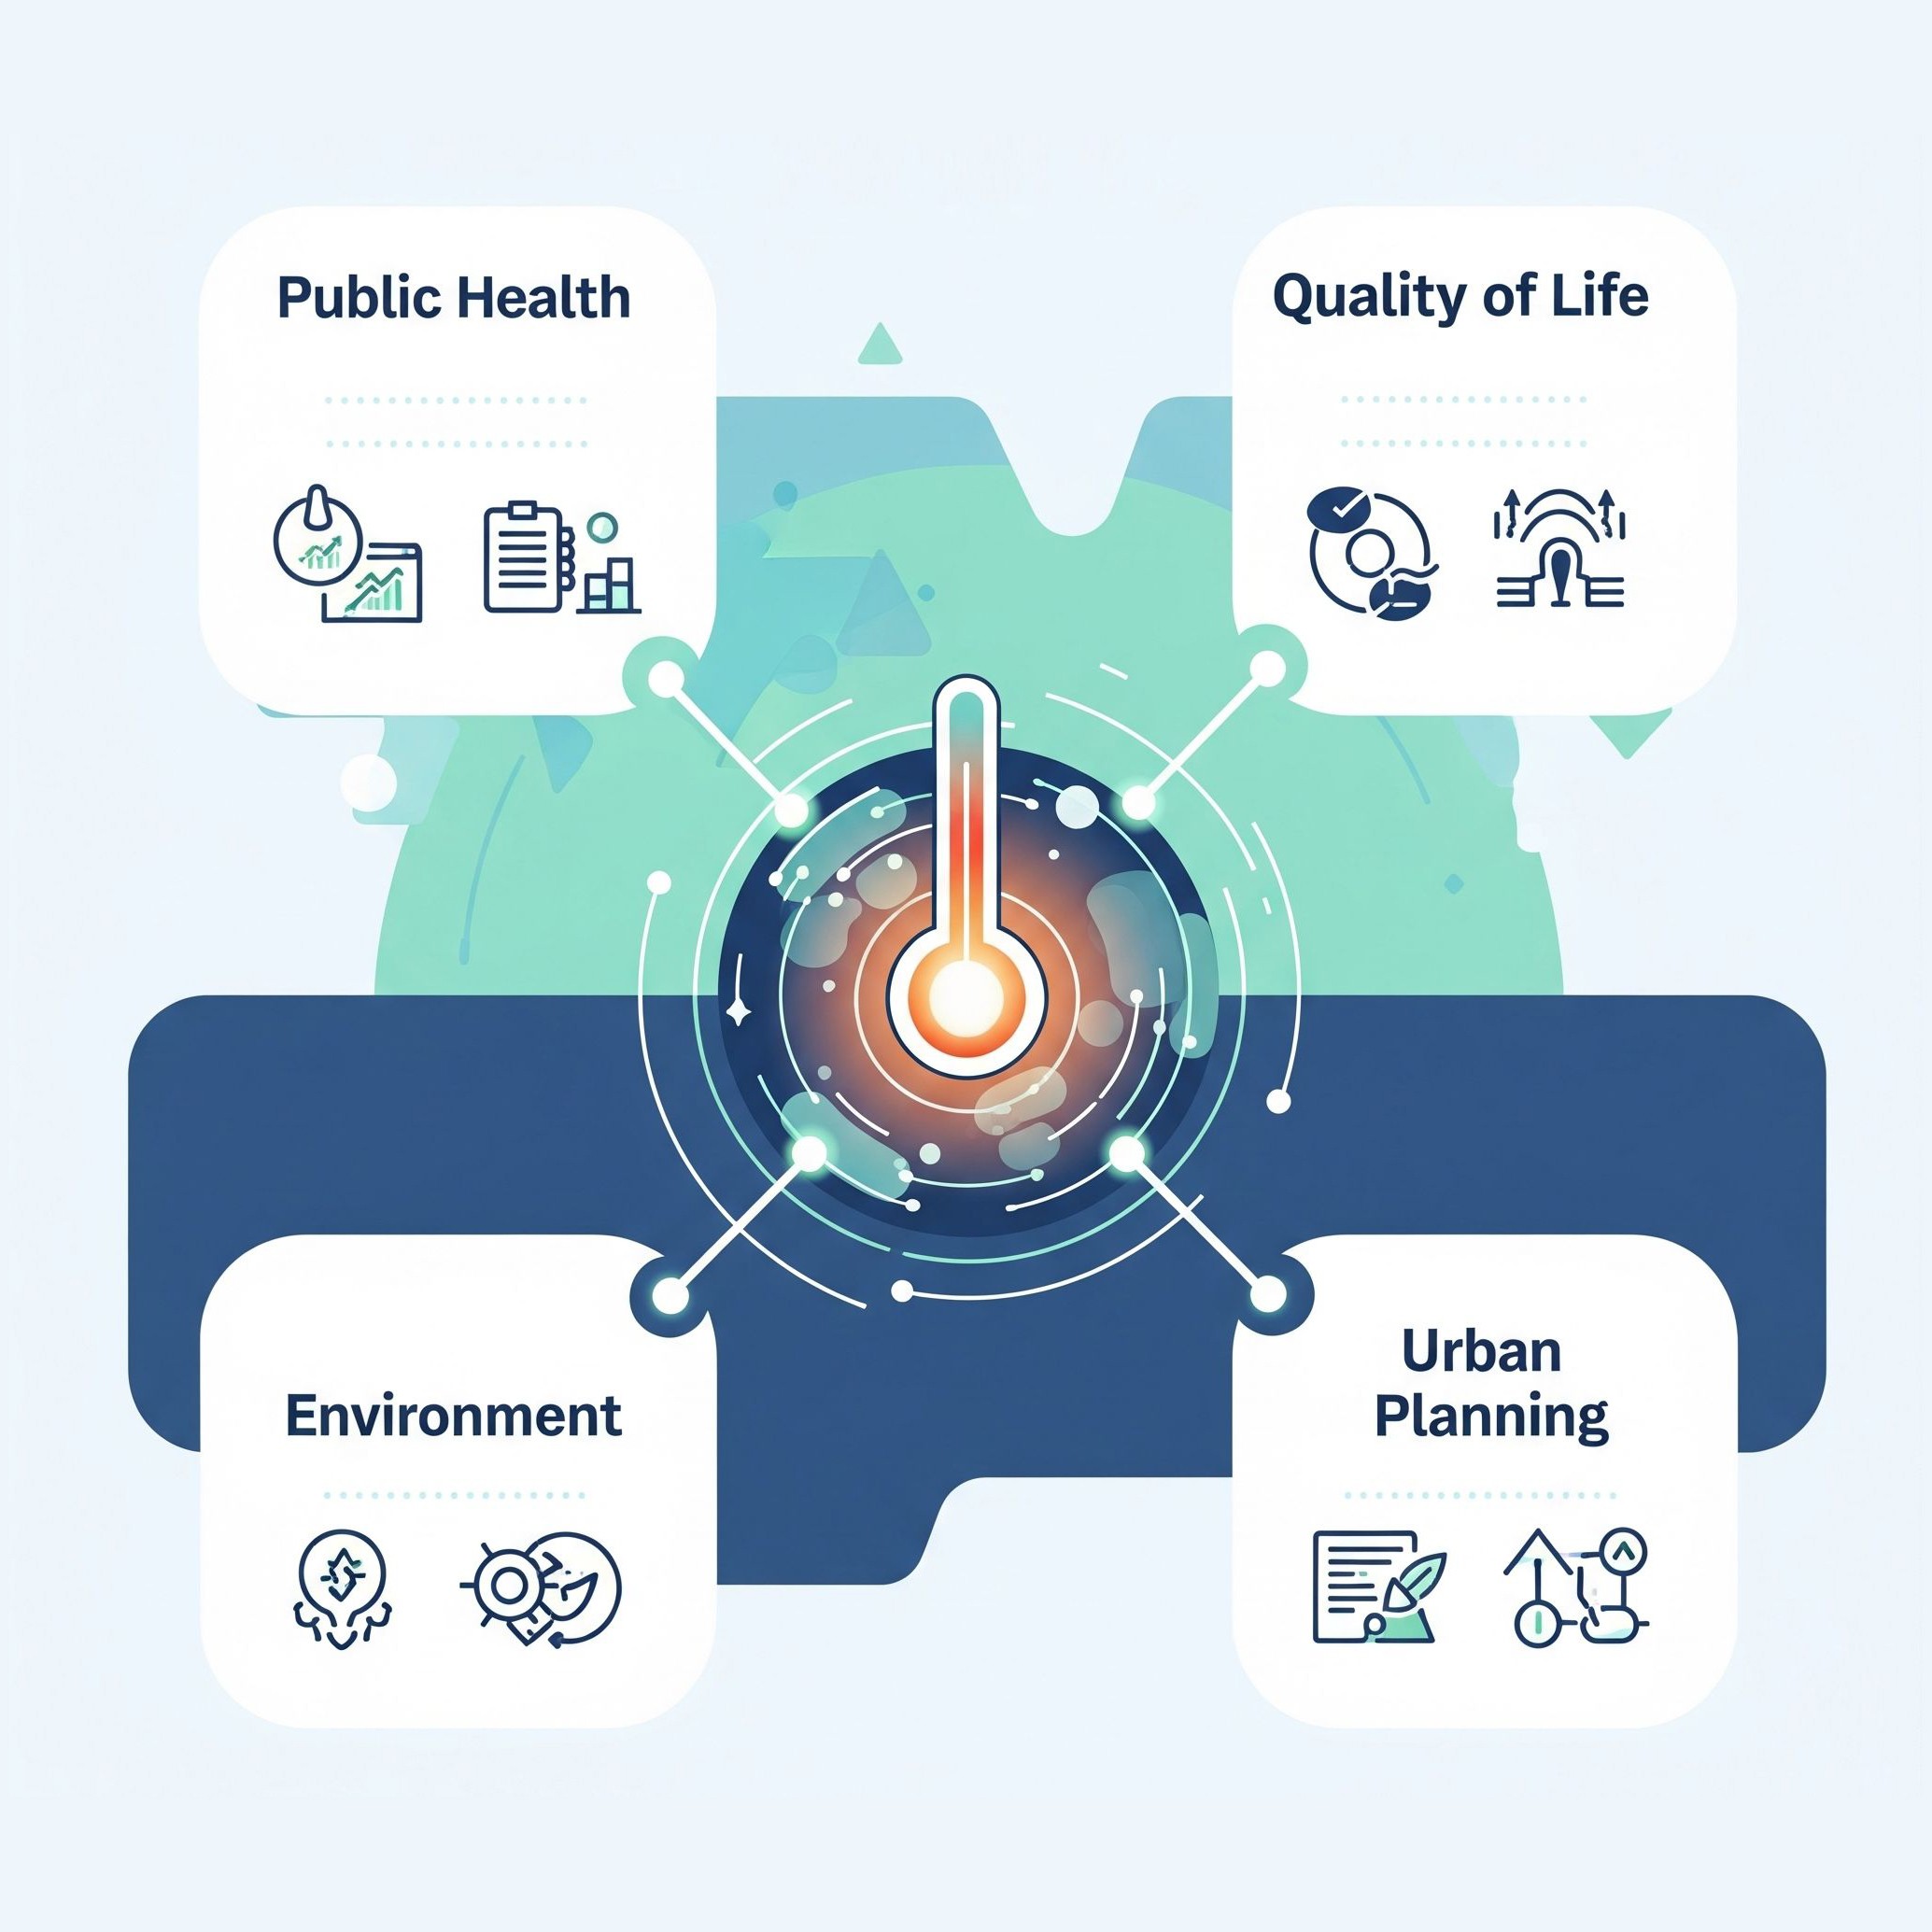
UHI impact inter alia public health, quality of life, environment and urban planning.
UHI effect increases risk of heatstroke, dehydration, and cardiovascular and respiratory illnesses, especially during heatwaves. Citizens which experience UHI can be affected by reduced comfort, productivity, and sleep quality. For environment, UHI means higher energy demand for cooling, increased greenhouse gas emissions, and deteriorating air quality. For these reasons, identifying and mitigating UHIs is crucial for sustainable city development.
UHI is observed and analysed using air temperature measurements. The limitation of this approach is a number of meteorological stations within the city.
Using satellites, we can measure land surface temperature (LST) and use it for estimation of surface urban heat island (SUHI), which is correlated with UHI. SUHI is easier to measure over large areas because satellites can capture surface temperatures continuously, whereas UHI air temperature measurements require many weather stations.

All presented results and products are based on open data delivered by European Copernicus programme. SUHI Intensity are generated using LST acquired by Land Surface Temperature Radiometer (SLSTR) instrument onboard the Sentinel-3 satellites.
Sentinel-3A and Sentinel-3B provide daily measurements of LST values with 1km pixel size, as Level-2 product. Data is available via Copernicus Data Space Ecosystem.
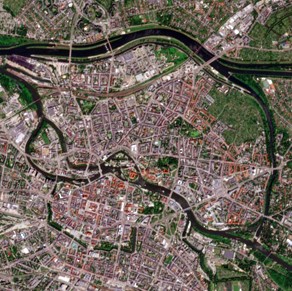
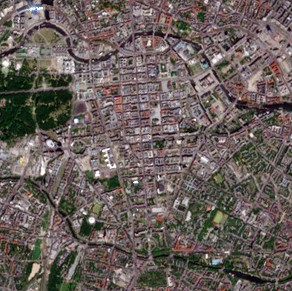
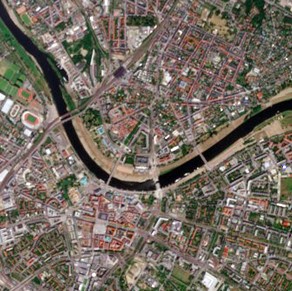
CBK PAN has prepared a complex analysis of SUHI intensity within selected cities in Poland and Germany. Using LST data from Sentinel-3 satellites, daily, monthly, seasonally and yearly SUHI intensity products have been prepared and published online in the form of interactive maps. Choose the city to explore the SUHI maps.